Original Article
|
|
|
|
| |
| Year : 2017 | Volume
: 5
| Issue : 3 |
Page : 23-27 |
|
|
Method development and validation of hydrochlorothiazide and Nebivolol in bulk and tablet formulation by reverse phase-high performance liquid chromatography method
Sufiyan Ahmad, Warude Kapil, Ansari Maaz, Patil Amol, Sharma Deepika
DOI: 10.31555/jpbs/2017/5/3/23-27
Correspondence Address:Department of Quality Assurance and Pharmacognosy, Gangamai College of Pharmacy, Nagaon, Dhule, Maharashtra, India
Source of Support: None,
Conflict of Interest: Nill
 |
Check
|
DOI: 10.4103/2231-4040.197331
The present work describes development and validation by high-performance liquid chromatography
by UV detector procedure for the analysis of hydrochlorothiazide (HCZ) and Nebivolol (NBL) in
pharmaceutical mixture. Effective chromatographic separation of HCZ and NBL was achieved using
a Youngline (S.K.) Gradient System UV detector. Reverse phase (GRACE) C18 column, (4.6 mm
× 250 mm; 5 μm), an SP930D pump, a 20 μl injection loop, and UV 730D absorbance detector
and running Autochro-3000 software. Mobile phase composed of 0.1% solution of orthophosphoric
acid in water and methanol in the proportion of (40:60), respectively. The flow rate is 0.7 ml/min
on detecting wavelength 282 nm. The PH of mobile phase was 3.2. The proposed high-performance
liquid chromatography method was statistically validated with respect to linearity, ranges, precision,
accuracy, selectivity, limit of detection, limit of quantitation and robustness. The retention time
of HCZ and NBL and were found to be 4.6833 and 9.18333, respectively. All parameters were
found to be within the acceptance limit. The calibration curves were linear in ranges of 25-125 and
10-50, μg/ml respectively for HCZ and NBL. The R2 of HCZ and NBL was found to be 0.999,
0.999, respectively.
Keywords: GRACE, nebivolol, reverse phase-high performance liquid chromatography, validation
How to cite this article:
Ahmad S, Kapil W, Maaz A, Amol P, Deepika S. Method development and validation of hydrochlorothiazide and Nebivolol in bulk and tablet formulation by reverse phase-high performance liquid chromatography method. J Pharm BioSci 2017;5(3):23-27.
|
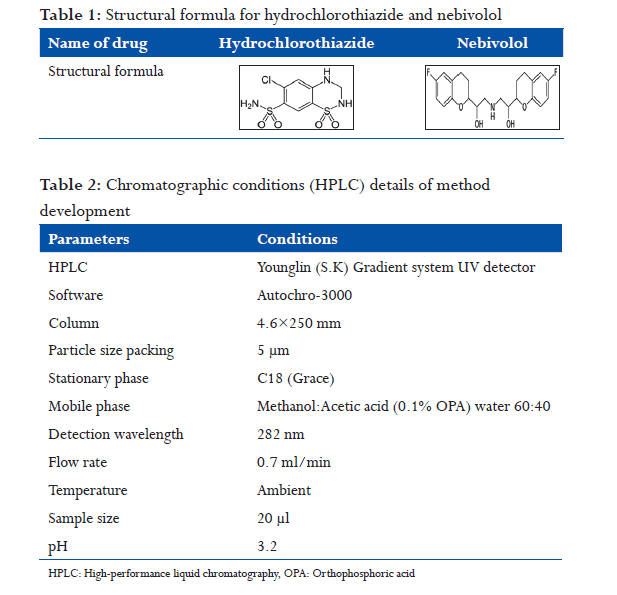
Introduction
Hydrochlorothiazide (HCZ) is 6-chloro-1, 1-dioxo-3, 4-dihydro- 2H-1, 2, 4-benzothiadiazine-7-sulfonamide, molecular formula was C7H8CIN3O4S2. HCZ belongs to thiazide class of diuretics. It reduces blood volume by acting on the kidneys to reduce sodium (Na+) reabsorption in the distal convoluted tubule.[1-3] The major site of action in the nephron appears on an electroneutral NaCl cotransporter by competing for the chloride site on the transporter. By impairing Na transport in the distal convoluted tubule, HCZ induces a natriuresis and concomitant water loss.[4] Thiazides increase the reabsorption of calcium in this segment in a manner unrelated to sodium transport. In addition, by other mechanisms, HCTZ is believed to lower peripheral vascular resistance.[5-7]
Nebivolol (NBL) is (6-fluorochroman-2-yl)-{[2-(6-fluorochroman- 2-yl)-2 hydroxyethyl] amino} ethanol, molecular formula was C22H25F2NO4. Table 1 NBL is unique as a beta-blocker. Unlike carvedilol, it has a nitric oxide (NO)-potentiating, vasodilatory effect. Along with labetalol, celiprolol and carvedilol, it is one of four beta blockers to cause dilation of blood vessels in addition to effects on the heart. However, recent studies question the clinical relevance of this property to NBL’s efficacy.[8-13]
Material and Methods
Chemicals and reagents
Working standards of pharmaceutical grade HCZ and NBL were obtained as generous gifts from Swapnroop Drug and Pharmaceutical. They were used without further purification. Fixed dose combination Tablet Torrent Pharma Mumbai (India) containing 10 mg NBL and 25 mg HCZ was purchased from local market. All the chemicals were of high-performance liquid chromatography (HPLC) grade, purchased from Merck Chemicals, India. Water used was double distilled and filtered through 0.45 μ filter.
Instrumentation
The analysis of the drug was carried out on Youngline (S.K.) Gradient System UV detector. Reverse phase (GRACE) C18 column, (4.6 mm × 250 mm; 5 μm), an SP930D pump, a 20 μl injection loop, and UV730D absorbance detector and running autochro-3000 software.
Preparation of standard stock and sample solution
Preparation of standard stock solution
They can accurately weighed the quantity of about 12.5 mg of HCZ and 5 mg of NBL was transferred into 10 ml volumetric flask. About 10 ml of methanol was added and sonicated to dissolve. The solution was cooled at room temperature and made up to volume with Methanol. Stock solutions of 1250 μg/ml of HCZ, 500 μg/ml of NBL obtained.
Preparation of mixed standard solution
A mixed standard solution was prepared from these stock solutions by transferring 0.1 ml of each of the stock solution to a 10 ml volumetric flask and diluting with a mobile phase to get a solution of 12.5 μg/ml and 5 μg/ml of HCZ, and NBL respectively.
Preparation of sample solution of tablet
For analysis of the tablet dosage form, 20 tablets were weighed individually, and their average weight was determined after that they were crushed to fine powders and power equivalent to weight 403 mg of tablet was weighed and transferred to 10 ml volumetric flask to form 1000 μg/ml HCZ and 1500 μg/ml NBL. Both were dissolved in HPLC grade Methanol: Acetic acid (0.1% orthophosphoric acid [OPA]) water both the solutions were shaken vigorously for 10 min and filtered through 0.45 μg nylon membrane filters. Then volume was made up to mark with Methanol: Acetic acid (0.1% OPA) water as taken and diluted to 10 ml with mobile phase to get a solution containing 10 μg/ml and 30 μg/ml, respectively. The amounts of HCZ and NBL per tablet were calculated by extrapolating the value of area from the calibration curve. The analysis procedure was repeated 5 times with tablet formulation. The result is shown in Table 2.
Results and Discussion
Method development and optimization of chromatographic conditions
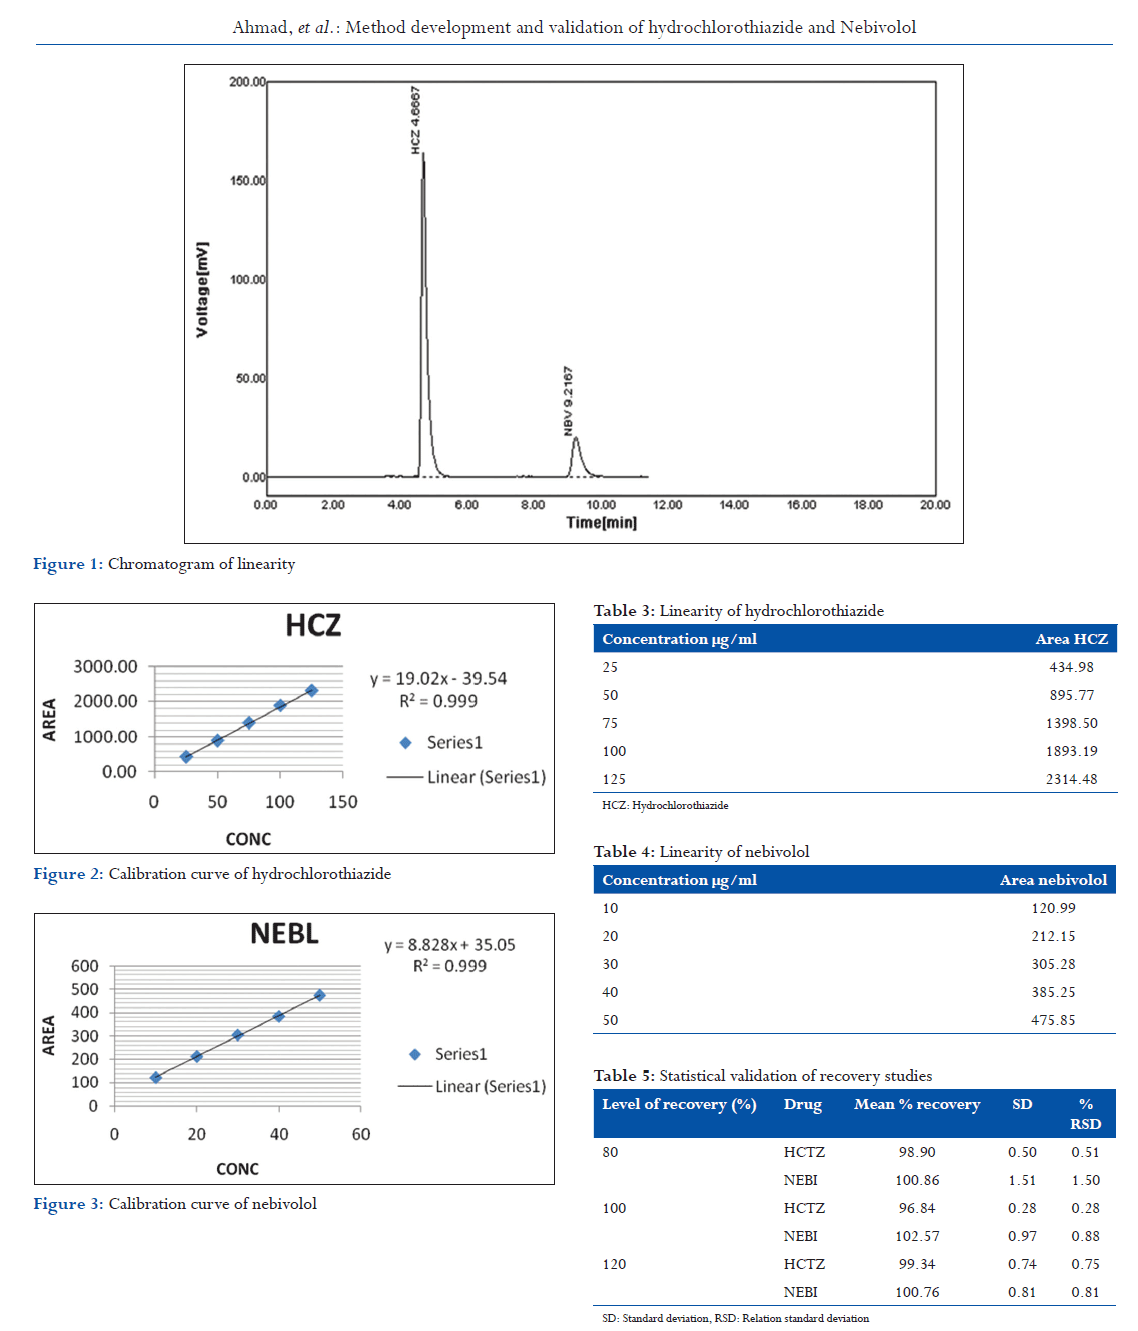
The development of the method was based on the experience obtained from the HPLC method previously developed for the analysis of a mixture of analytes comprising simultaneous determination of HCZ and NBL. Experiments previously suggest the use of C18 stationary phases of (250: 4.5 mm i.d., 20 μ particle size, and 5 m). For the separation of all the two analytes in the mixture, the composition of mobile phase was varied. Parameter such as mobile phase composition of buffer was exhaustively studied so as to achieve a reasonable degree of separation of analytes. Several binary or ternary eluants were tested using different proportions of solvent, such as acetonitrile, methanol, water, and buffer at different pH conditions (Figure 1). Chromatogram obtained during method development.
Initially, isocratic mode of separation was experimented and was found insufficient to resolve the mixture with good peak characters but after many trial methods developed in isocratic system. Method selected so as to achieve separation of analytes with good peak characters. The mean retention time (RT) of two analytes was and min, respectively. Peak identification was done by injecting individual analyte in developed chromatographic conditions.
Method validation
Linearity
From HCZ standard stock solution, different working standard solutions (5-25 μg/ml) were prepared in mobile phase. Likewise, from NBL standard stock solution different working standard solution (50-250 μg/ml) was prepared in mobile phase. 20 μl of the sample solution was injected into the chromatographic system using fixed volume loop injector. Chromatograms were recorded. The area for each concentration was recorded (Tables 3 and 4). The calibration curves are shown in following Figures 1-3.
Accuracy
Recovery studies were performed to validate the accuracy of the developed method. To pre-analyzed tablet solution, a definite concentration of standard drug (80%, 100%, and 120%) was added and then its recovery was analyzed. Statistical validation of recovery studies is shown in Table 5.
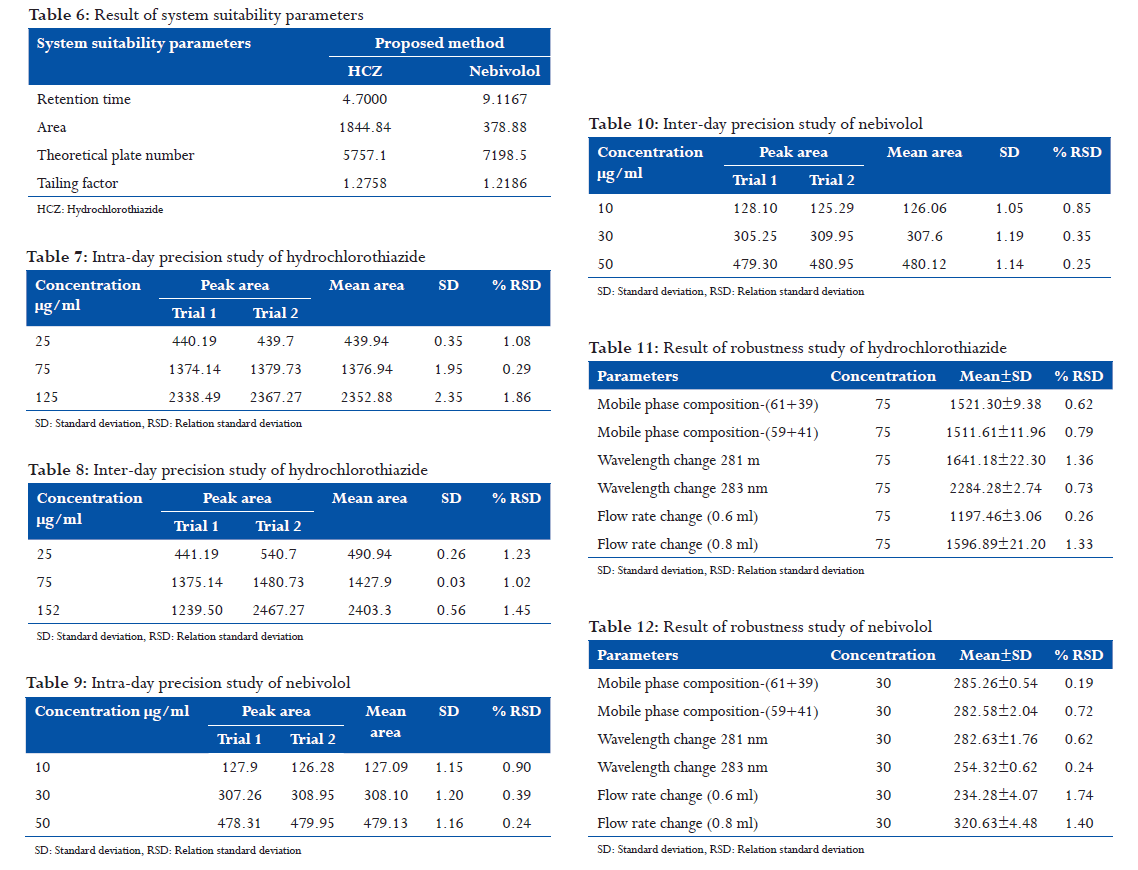
System suitability parameters
To ascertain the resolution and reproducibility of the proposed chromatographic system for estimation of HCZ and NBL system suitability parameters were studied Table 6.
Precision
The method was established by analyzing various replicates standards of HCZ and NBL. All the solution were analyzed thrice to record any intra- and inter-day variation in the result. The result obtained for interday are shown in Tables 7 and 10 the result obtained for inter-day variation are shown in the Tables 8 and 9, respectively.
Robustness
The robustness of a method is its ability to remain unaffected by small deliberate changes in parameters. To evaluate the robustness of the proposed method, small but deliberate variations in the optimized method parameters were done. The effect of changes in mobile phase composition and flow rate on RT and tailing factor of drug peak was studied.
The mobile phase composition was changed in ±1 ml proportion, and the flow rate was varied by ±0.7 ml min−1, of the optimized chromatographic condition. The results of robustness studies are shown in Tables 11 and 12. System suitability parameters were also found satisfactory; hence, the analytical method would be concluded.
Limit of detection (LOD)
The detection limit of an individual analytical procedure is the lowest amount of analyte in a sample, which can be detected but not necessarily quantitated as an exact value. LOD is expressed as a concentration at a specified signal to noise ratio. It may be calculated based on standard deviation of the response and slope of the curve.
LOD=3.3(SD)/S
Where, SD = Standard deviation of Y intercept
S=Slope
Limit of quantitation (LOQ)
The quantitation limit of an individual analytical procedure is the lowest amount of analyte in a sample, which can be quantitatively determined with suitable precision and accuracy.
LOQ=10(SD)/S Where, SD = Standard deviation Y intercept S=Slope Specificity can be defined as the ability to measure accurately the concentration of an analyte in the presence of all other sample material.[14-21] HCZ=LOD=1.30 NBL=LOD=1.13 LOQ=3.96 LOQ=3.42
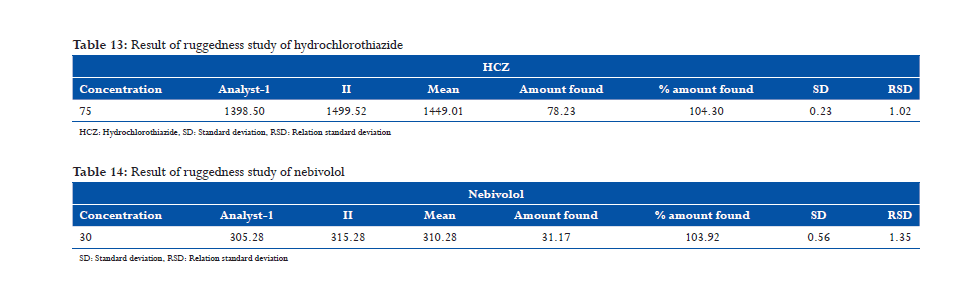
Ruggedness
The ruggedness of an analytical method in which the degree of reproducibility of test result obtained by the analysis of the same sample under a variety of environmental condition that may differ but are still within the specified parameters of the assay. Result of ruggedness study was shown in Table 13-14.
Conclusion
Attempts were made to develop reverse phase (RP)-HPLC method for simultaneous estimation of HCZ and NBL from the tablet. For the RP-HPLC method, Younglin (S.K) isocratic system UV detector and C18 column with 250 mm × 4.6 mm i.d and 5 μm particle size. Methanol: Acetic water (0.1% OPA), (60:40) v/v, pH 3.2 was used as the mobile phase for the method. The detection wavelength was 282 nm and flow rate was 0.7 ml/min. In the developed method, the RT of HCZ and NBL sodium were found to be 3.4667 min and 5.4000 min. The developed method was validated according to the ICH guidelines. The linearity, precision, range, robustness was within the limits as specified by the ICH guidelines. Hence, the method was found to be simple, accurate, precise, economic, and reproducible.
Hence, the proposed methods can be used for the routine quality control analysis HCZ and NBL in bulk drug as well as in formulations.
Acknowledgments
The authors are grateful to Swapnroop Drug and Pharmaceutical (India) for providing gift samples of HCZ and NBL and also thankful to Management and Dr. V. M. Shastry, Principal of Gangamai College of Pharmacy, Nagaon Dhule for providing timely support for the research work.
References
- Agabiti Rosei E, Rizzoni D. Metabolic profile of nebivolol, a beta-adrenoceptor antagonist with unique characteristics. Drugs 2007;67:1097-107.
- Bakris G. An in-depth analysis of vasodilation in the management of hypertension: Focus on adrenergic blockade. J Cardiovasc Pharmacol 2009;53:379-87.
- Baldwin CM, Keam SJ. Nebivolol: In the treatment of hypertension in the US. Am J Cardiovasc Drugs 2009;9:253-60.
- De Boer RA, Voors AA, van Veldhuisen DJ. Nebivolol: Third-generation betablockade. Expert Opin Pharmacother 2007;8:1539-50.
- Bundkirchen A, Brixius K, Bölck B, Nguyen Q, Schwinger RH. Beta 1-adrenoceptor selectivity of nebivolol and bisoprolol. A comparison of [3H]CGP 12.177 and [125I]iodocyanopindolol binding studies. Eur J Pharmacol 2003;460:19-26.
- Gielen W, Cleophas TJ, Agrawal R. Nebivolol: A review of its clinical and pharmacological characteristics. Int J Clin Pharmacol Ther 2006;44:344-57.
- Gupta Y, Shrivastava A, Duggal D, Patel A, Agrawal S. A new RP-HPLC method for simultaneous estimation of nebivolol hydrochloride and hydrochlorthiazide in dosage forms. J Young Pharm 2009;1:264-9.
- Modiya JS, Pandya CB, Channabasavaraj KP. Simultaneous estimation of nebivolol hydrochloride and valsartan in bulk and capsule dosage form by simultaneous equation method. Int J Chem Tech Res 2010;2:1387-90.
- Kamila MM, Mondal N, Ghosh LK, Gupta BK. A validated UV spectrophotometric method for estimation of nebivolol hydrochloride in bulk and pharmaceutical formulation. Pharmazie 2007;62:486-7.
- Christian GD. In: Analytical Chemistry. 6th ed. New York: John Wiley and Sons; 2004. p. 1-7.
- Beckett AH, Stenlake JB. In: Practical Pharmaceutical Chemistry. Vol. 4. New Delhi: CBS Publishers and Distributors; 2002. p. 275-8, 281-300.
- Brown RP. Reversed-Phase High Performance Liquid Chromatography: Theory, Practice and Biomedical Applications. New York: Wiley; 1982. p. 10-20.
- Erwing GW. Instrumental Methods of Chemical Analysis. 2nd ed. New York: McGraw Hill Publishing Company Inc.; 1960. p. 1-3.
- ICH. ICH Harmonized Tripartite Guidelines. Validation of Analytical Procedures: Methodology. Geneva: ICH; 1996. p. 1-8.
- ICH. Q2A, Text on Validation of Analytical Procedures, International Conference on Harmonization. Geneva: ICH; 1994. p. 1-5.
- ICH. Q2B, Validation of Analytical Procedures: Methodology, International Conference on Harmonization. Geneva: ICH; 1996. p. 1-8.
- Jeffery GH, Bassett J, Mendham J, Denney RC. Vogel’s Textbook of Quantitative Chemical Analysis. 5th ed. Singapore: Addison Wesley Longman Inc.; 2001. p. 4-5.
- Sethi PD. In: HPLC ‘High Performance Liquid Chromatography’, Quantitative Analysis of Pharmaceutical Formulations. 1st ed. New Delhi: CBS Publishers and Distributors; 2001. p. 3-72, 116-20.
- Settle F. In: Handbook of Instrumental Techniques for Analytical Chemistry. New Delhi: Pearson Education Pvt. Ltd.; 2004. p. 154-6.
- Skoog DA, Holler FJ, Nieman TA. In: Principles of Instrumental Analysis. 5th ed. Belmont, CA: Thomson Brooks/Cole; 1998. p. 329-35.
- Skoog DA, Holler FJ, Nieman TA. Principles of Instrumental Analysis. 5th ed. Singapore: Thomson Brooks/Cole Asia Pvt. Ltd.; 2004. p. 4-7.
|