Original Article
|
|
|
|
| |
| Year : 2017 | Volume
: 5
| Issue : 1 |
Page : 6-9 |
|
|
Simultaneous spectrophotometric estimation of atenolol and chlorthalidone in tablet dosage form
Hitesh C. Pimple, Sachin S. Rane, Hemant D. Patil, Rajesh Y. Chaudhari, Vijay R. Patil
DOI: 10.31555/jpbs/2017/5/1/6-9
Correspondence Address:Department of Pharmaceutical Chemistry, T.V.E.S.’s Hon. L. M. C. College of Pharmacy, Jalgoan, Maharashtra, India
Source of Support: Nil,
Conflict of Interest: None Declared
 |
Check
|
DOI: 10.4103/2231-4040.197331
The accurate, precise, sensitive, and economical spectrophotometric method was developed and validated for simultaneous estimation of atenolol (ATN) and chlorthalidone in tablet dosage form. The ultraviolet method employed was simultaneous equation method. The method employs 318 nm as λ1 and 290 nm as λ2 for the formation of equations. ATN and chlorthalidone obeys Beer’s law in the concentration range 10-160 μg/mL−1 (r2 = 0.9957) and 5-25 μg/mL−1 (r2 = 0.9965). The mean recovery for ATN and chlorthalidone was found to be 100.11 ± 0.483% and 100 ± 0.534%, respectively. The developed method was validated according to ICH guidelines and values of accuracy, precision, and other statistical analysis were found to be in good accordance with the prescribed values. Thus, the proposed methods were successfully applied for simultaneous determination of ATN and chlorthalidone in routine industrial work.
Keywords: Atenolol, chlorthalidone, validation, simultaneous equation method
How to cite this article:
Pimple HC, Rane SS, Patil HD, Chaudhari RY, Patil VR. Simultaneous spectrophotometric estimation of atenolol and chlorthalidone in tablet dosage form. J Pharm BioSci 2017;5(1):6-9
|
Introduction
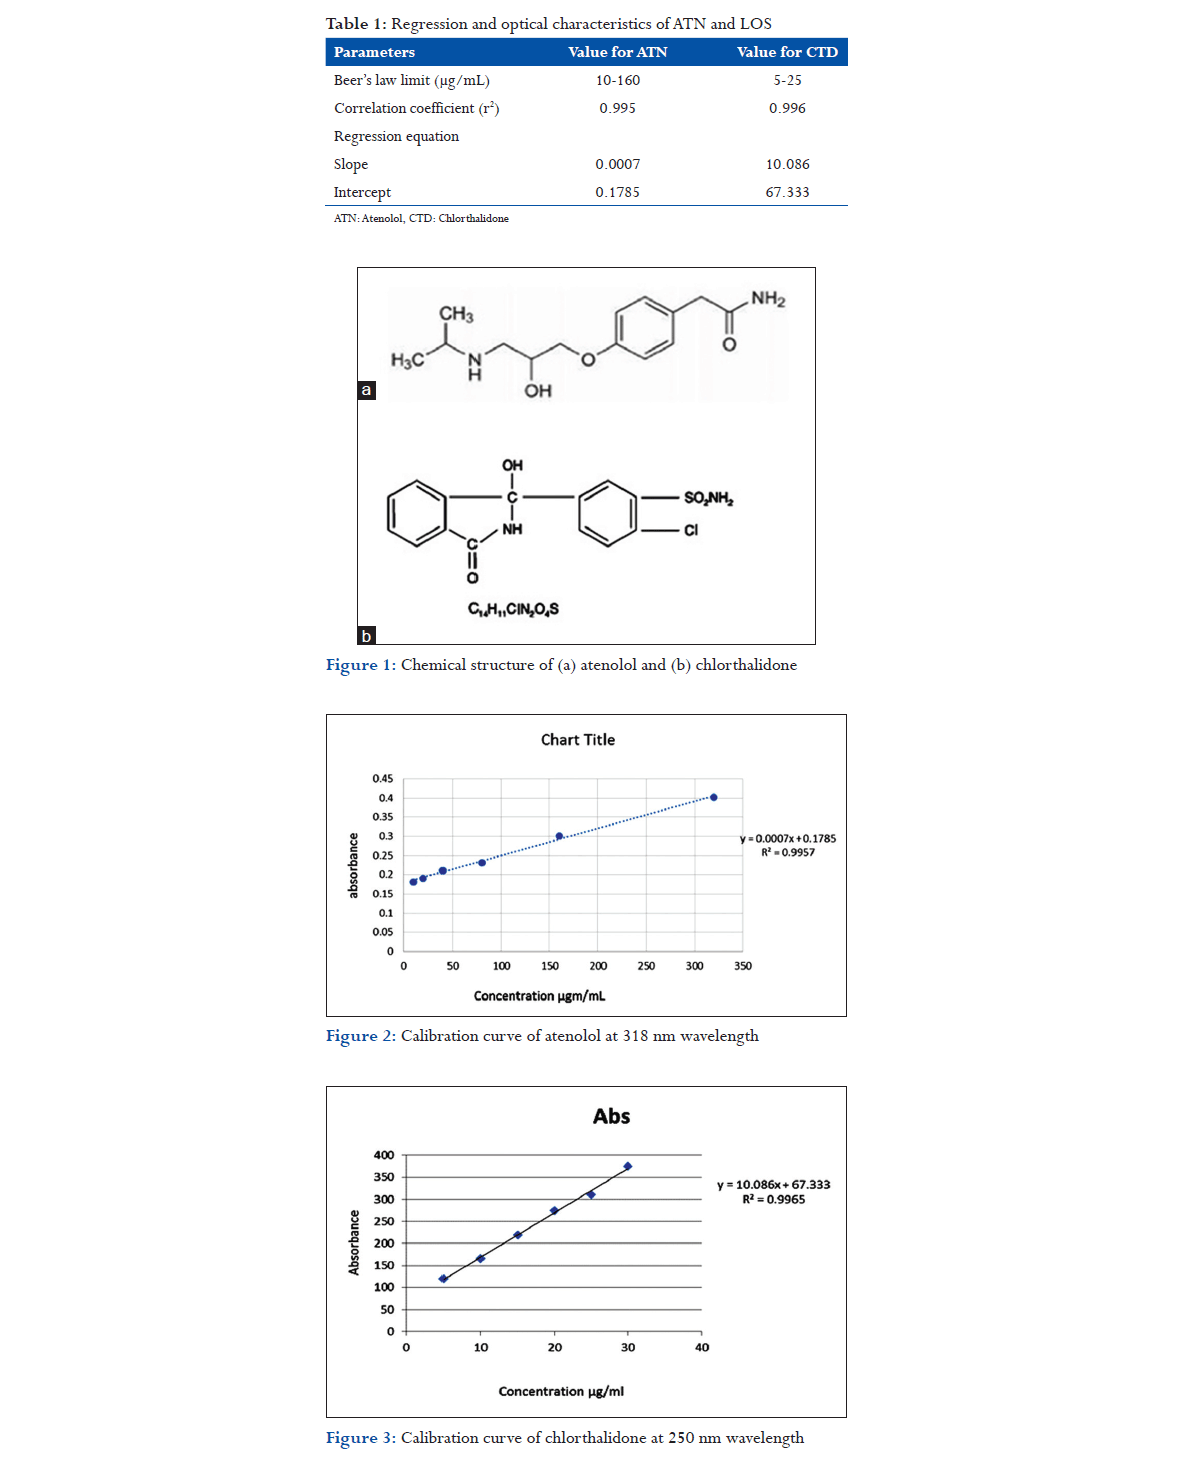
Drugs play a vital role in the progress of human civilization by curing diseases. Analytical chemistry is divided into two branches qualitative and quantitative.[1] Atenolol (ATN) is a β1 receptor specific antagonist, chemically (RS)-4-(2-hydroxy-3-isopropylaminopropoxy) phenylacetamide,[2] chlorthalidone (CTD), 2-chloro-5-(1-hydroxy-3-oxo-2, 3-dihydro-1H-isoindol-1-yl) benzenesulfonamide (Figure 1).[3] ATN and chlorthalidone combination is used in treatment of hypertension. Several methods are available in the literature for the determination of ATN and CTD. Most of these methods are for the determination of ATN and CTD separately or in combination with other drug. Analytical methods reported for quantitative determination of ATN individually in pharmaceutical formulations or biological fluids are high-performance liquid chromatographic (HPLC)[4-6] and ultraviolet (UV).[7-9] Analytical methods reported for quantitative determination of CTD individually in pharmaceutical formulations or biological fluids are HPLC,[10-13] UV,[14,15] and HPTLC.[16,17]
Materials and Methods
Experimental
Chemicals and reagents
ATN was obtained as a generous gift samples from the Zydus Healthcare Pharmaceuticals Pvt. Ltd. (Sikkim), and chlorthalidone from Ipca laboratories Ltd. (Mumbai). Commercial pharmaceutical preparation TENORIC-25 tablets manufactured by Emcure Pharma. Ltd. containing 25 mg of ATN and 12.5 mg of CTD was collected from local market. Acetonitrile, methanol, and water used were of analytical grade (Qualigens Fine Chemicals, Mumbai, India). A 0.45 μm nylon filter (Pall life Sciences, Mumbai, India) was used. All other chemicals and reagents used were analytical grade unless otherwise indicated.
Instrumentation
The proposed work was carried out on a Shimadzu UV-visible spectrophotometer (model UV-1800 series), which possesses a double beam double detector configuration with a1 cm quartz matched cell. All weighing was done on electronic balance (Sansui-vibra DJ-150S-S). A Fast clean ultrasonicate cleaner (India) was used for degassing the mobile phase.
Selection of solvents
On the basis of solubility, study methanol was selected as the solvent for dissolving ATN and CTD.
Preparation of standard stock solutions of ATN and CTD
ATN stock solution
An accurately weighed quantity of ATN (25 mg) was taken in 25 mL volumetric flask and dissolved in methanol (20 mL) with the help of ultrasonication for about 10 min. Then, the volume was made up to the mark using methanol to get ATN standard stock solution (1 mg/mL).
ATN working standard solution
ATN standard stock solution 5 mL was diluted to 25 mL using 60% v/v methanol to get working standard solution 100 μg/mL.
Chlorthalidone stock solution
An accurately weighed quantity of CTD (12.5 mg) was taken in 25 mL volumetric flask and dissolved in methanol (20 mL) with the help of ultrasonication for about 10 min. Then, the volume was made up to the mark using methanol to get Losartan standard stock solution (1 mg/mL).
Chlorthalidone working standard solution
Losartan standard stock solution 5 mL was diluted to 25 mL using 60% v/v methanol to get working standard solution 100 μg/mL.
Determination of λ max of individual component
An appropriate aliquot portion of ATN (0.8 mL) and CTD (0.6 mL) were transferred to two separate 10 mL volumetric flasks; the volume was made up to the mark using 60 %v/v methanol to obtain ATN (80 μg/mL) and CTD (60 μg/mL). Drug solutions were scanned separately between 200 and 400 nm. ATN shows λ max at 318 nm while CTD at 290 nm, respectively.
Overlay spectra of ATN and chlorthalidone
The overlain spectrum of both drugs was recorded wavelengths 318.0 nm (λ max of ATN) and 290 nm (λ max of CTD) was selected for further study.
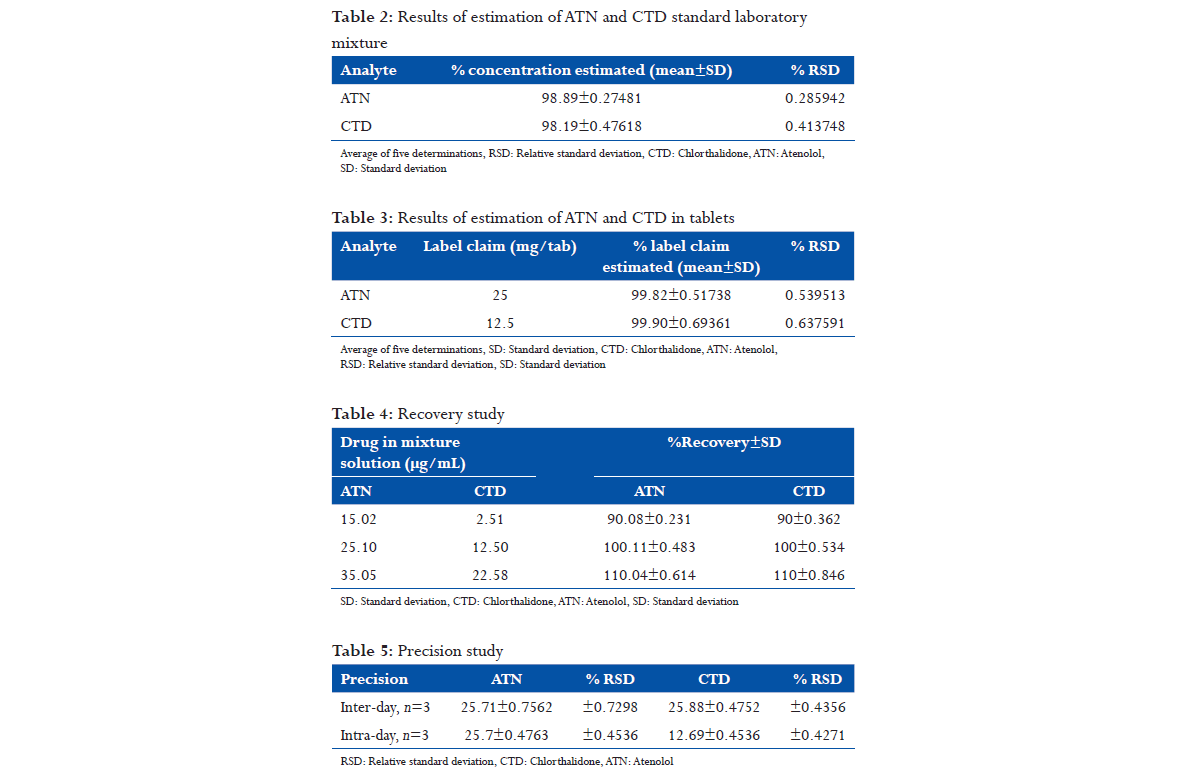
Linearity study for ATN
An accurately measured aliquot portion of working standard solution of ATN was transferred to seven separate 10 mL volumetric flasks. The volume was made up to the mark using 60% v/v methanol to obtain concentrations (10-160 μg/mL). The absorbance of these solutions was measured at 318 nm, (Table 1) calibration curve was plotted, absorbance versus concentration as shown in Figure 2.
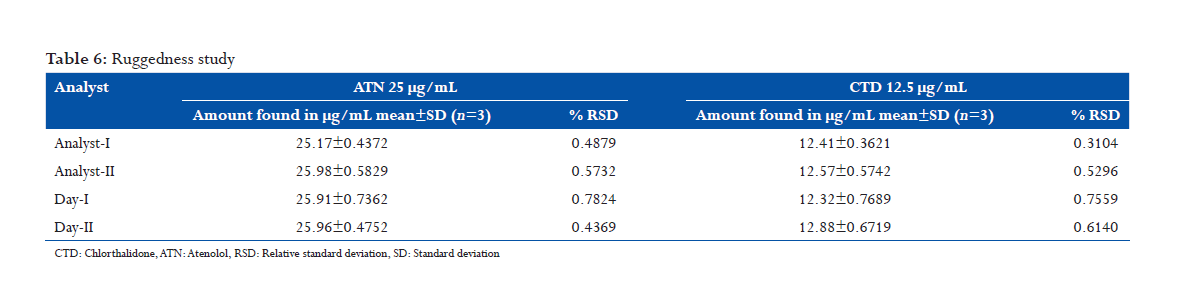
Linearity study for CTD
Accurately measured aliquot portions of working standard solution of CTD were transferred to seven separate 10 mL volumetric flasks. The volume was made up to the mark using 60% v/v methanol to obtain concentrations (5-25 μg/mL). The absorbance of these solutions was measured at 290 nm, (Table 1). Calibration curve was plotted absorbance versus concentration as shown in Figure 3.
Estimation of laboratory mixture by proposed method
To see the feasibility of proposed method for simultaneous estimation of ATN and CTD in marketed pharmaceutical formulations, the method was first tried for estimation of drugs in standard laboratory mixture. Accurately weighed ATN (25 mg) and CTD (12.5 mg) were taken in 100 mL volumetric flask, dissolved in methanol (60 mL) with the help of ultrasonication for about 10 min, and the volume was made up to mark using the same. Appropriate aliquot portion (1 mL) was transferred to 10 mL volumetric flask and further diluted using 60% v/v methanol to get ATN (25 μg/mL) and CTD (12.5 μg/mL). The absorbance was recorded at 318 nm and 290 nm against solvent as blank.
Amount of each drug was estimated using following equations

Where;
A1 and A2 are the absorbance of diluted mixture at λ1 and λ2
Cx and Cy are the concentration of X and Y, respectively
ax1 and ax2 are absorptivities of X at λ1 and λ2, respectively
ay1 and ay2 are absorptivities of Y at λ1 and λ2, respectively
The results are reported in Table 2.
Application of the proposed method for estimation of drugs in tablets
Twenty “Nusar-ATN” tablets containing ATN (25 mg) and CTD (12.5 mg) were weighed and ground to fine powder. A quantity of sample equivalent to ATN (25 mg) and CTD (12.5 mg) was transferred into 100 mL volumetric flask containing methanol (60 mL), sonicated for 15 min, and the volume was made up to the mark and filtered through Whatman filter paper (No. 45). This solution was (1 mL) transferred to 10 mL volumetric flask, dissolved, and volume was adjusted to the mark. The absorbance of the solutions was measured at 318 nm and 290 nm against blank. The concentrations of two drugs in sample were determined using simultaneous equations.
The results are reported in the Table 3.
Validation of proposed method
The Proposed method was validated as per the ICH guidelines.
Accuracy (recovery study)
The accuracy of proposed method was ascertained on the basis of recovery study performed by standard addition method. A known amount of standard drug solutions were added to the tablet powder to make final concentrations in the range of 80%, 100%, and 120% and reanalyzed it by the proposed method. The absorbance recorded, and the % recoveries were calculated using formula.
% Recovery=[A-B/C]×100
Where,
A=Total amount of drug estimated
B=Amount of drug found on preanalyzed basis
C=Amount of Pure drug added
The results are reported in Table 4.
Precision
Precision was determined as intra- and inter-day variations. Intraday precision was determined by analyzing ATN (20.62, 25.61, and 30 μg/mL) and CTD (7.50, 12.50, and 17.50 μg/mL) for three times on the same day. Inter-day precision was determined by analyzing the same concentration of solutions for three different days over a period of week. The results are reported in Table 5.
Ruggedness
The ruggedness of the proposed method was determined by the analysis of aliquots from homogenous slot by two different analyst using same operational and environmental conditions. The results are reported in Table 6.
LOD: Limit of detection of ATN and CTD were found to be 0.0382 μg/mL and 0.0573 μg/mL, respectively.
LOQ: Limit of quantitation of ATN and CTD were found to be 0.0584 μg/mL and 0.0745 μg/mL, respectively.
Results and Discussion
A simultaneous UV spectrophotometric estimation method was developed for ATN and CTD. The method employs 318 nm as λ1 and 290 nm as λ2 for formation of equations. ATN and CTD obeys Beer’s law in the concentration range 10-160 μg/mL−1 (r2 = 0.9957) and 5-25 μg/mL−1 (r2 = 0.9965). The mean recovery for ATN and CTD were found to be 100.11 ± 0.483% and 100 ± 0.534%, respectively. The developed method was validated according to ICH guidelines and values of accuracy, precision, and other statistical analysis were found to be in good accordance with the prescribed values.
Conclusion
The proposed simultaneous UV spectrophotometric estimation method presented in this paper has advantages of simplicity, accuracy, precision, and convenience for quantitation of ATN and CTD. The proposed method can be used for the quality control of ATN and CTD in typical laboratories.
References
- Jeffery GH, Mandham BJ, Denny RC. editors. Vogel’s Text Book of Quantitative Chemical Analysis. 5th ed. UK: Longman Scientific and Technical Publisher; 1994. p. 3-4.
- Gaur R, Azizi M, Gan J, Hansal P, Harper K. editors. British Pharmacopoeia. London: Medicines and Healthcare Products Regulatory Agency (MHRA); 1988. p. 49, 903.
- Martin J, Claase LA, Jordan B, Macfarlane CR. British National Formulary. 27th ed. London: BMJ Group & RPS Publishing; 2009. p. 2314-6.
- Bhusari VK, Dhaneshwar SR. Validated HPTLC method for simultaneous estimation of atenolol, hydrochlorothiazide and amlodipine besylate in bulk drug and formulation. Int J Anal Bioanal Chem 2011;1:70-6.
- Chheta N, Gandhi SP, Rajput SJ. Development and validation of a stabilityindicating high performance liquid chromatographic (HPLC) method for atenolol and hydrochlorthiazidein bulk drug and tablet formulation. Int J ChemTech Res 2009;1:654-62.
- Krishna R, Gupta A, Wadodkar R, Wadodkar SG. Validated reverse phase HPLC method for simultaneous estimation of atorvastatin and atenolol in tablets. Der Pharm Lett 2011;3:393-403.
- Jaina N, Jaina R, Thakura N, Jaina S, Jain DK. Simultaneous spectrophotometric estimation of lercanidipine hydrochloride and atenolol in tablet dosage form. Eur J Anal Chem 2011;6:84-90.
- Lalitha G, Salomi PR. Development of an analytical method and its validation for the analysis of atenolol in tablet dosage form by UV-Spectrophotometry. Int J Pharm Pharm Sci 2009;5:197-9.
- Dey S, Sarkar S, Malakar J, Ghosh A, Gangopadhyay A, Mazumder B. Spectrophotometric method for simultaneous determination of atenolol and atorvastatin in tablet dosage forms. Int J Pharm Biomed Res 2012;3:40-3.
- Bapnal M, Bhoi KG. Development and validation of analytical method for simultaneous estimation of cilnidipine and chlorthalidone in their combined dosage form. Int J Ayurveda Pharm Chem2015;2:453.
- Devi AL, Sree GU, Ajitha A, Rao VU. A new RP-HPLC method development and validation for the dissolution studies of atenolol and chlorthalidone in immediate release tablet dosage forms. Int J Pharm Pharm Sci 2014;4:958-60.
- Charde MS, Welankiwar AS, Chakole RD. Development of validated RP-HPLC method for the simultaneous estimation of atenolol and chlorthalidone in combine tablet dosage form. Int J Anal Bioanal Chem 2014;3:563-4.
- Ganipisetty LA, Dachinamoorthy D, Seshagiri RJ. Stability indicating RPHPLC- PDA method for simultaneous estimation of olmesartan cilnidipine and chlorthalidone with forced degradation behavior study in bulk and in its tablet dosage form. Int J ChemTech Res 2015;5:584-5.
- Patel S, Patel D. Simultaneous determination of metoprolol succinate and chlorthalidone by UV spectrophotometric method. Der Pharm Lett 2013;1:362-4.
- Kavitha J, Muralidharan S. Development and validation of new method for atenolol, hydrochlorothiazide and losartan potassium by RP-HPLC: Its application to routine quality control analysis. Int J Pharm Biomed Res 2012;2:880-4.
- Parmar KE, Mehta RS. Development and validation of HPTLC method for simultaneous determination of telmisartan and chlorthalidone in bulk and pharmaceutical dosage form. Int J Pharm Pharm Sci 2011;2:356-8.
- Ingle SU, Patil PA, Kulkarni VC, Patil SV, Salunke PA, Wagh RS. Development and validation of UV spectrophotometric method for chlorthalidone in bulk and pharmaceutical dosage forms. Int J ChemTech Res 2010;3:958-63.
|